Categories
COVID-19 Visualizations

How memes go viral

For over a year now, my main research focus has temporarily shifted away from gravitational physics towards the mathematical modelling of COVID-19 (for obvious reasons). Although this might seem like a big change, the two areas actually share a lot in common. One of the main techniques for understanding cosmological dynamics as well as the spread of infectious disease is the theory of dynamical systems, which has played a key role in my research for many years. Similarly, Bayesian statistics are extremely useful for analyzing both astrophysical observations and COVID case counts.

I have also been interested in how various phenomena spread on graphs. Several years ago, I made this video on how memes go viral on the internet:

The idea is that there is a social network online describing the connections between individuals. If one person becomes interested in something (back then, the “ice bucket” challenge was in vogue), they might share it with their contacts, who in turn might share it with other people, and so on.

You might be thinking that this process sounds an awful lot like how an infectious disease spreads. The purpose of the above video is to push this analogy as far as we can by creating a disease model of how a “meme” spreads on the internet.

How about actual infectious diseases? Adapting the techniques in the video to model COVID-19 in New Brunswick was the topic of a problem at the 2021 AARMS Industrial Problem Solving Workshop. I presented this problem in collaboration with The Black Arcs, a local Fredericton company with expertise in detailed computer simulations of daily life in cities and towns. This project is ongoing, and is starting to yield some exciting results.

Categories
Visualizations

4-dimensional polyhedra

Several years ago (for reasons that I can’t really remember) I became interested in 4-dimensional polyhedra. I made some animations that I like looking at, and I wanted to try out my new blog, so here we are…

4-dimensional polyhedra are the higher dimensional generalizations of three dimensional objects such cubes and tetrahedrons. You can think of them as solid objects that are highly symmetric; that is, their edges all have the same length, their faces are all congruent, and the angles at all of their vertices are the same. A familiar 3-dimensional example is a cube whose consists of six identical 2-dimensional regions, each of which is a square. The 4-dimensional version of cube is called a tesseract (or 8-cell). It’s boundary consists of 8 identical 3-dimensional regions, each of which is a cube.

How can you visualize a 4-dimensional object? Well, strictly speaking this is not something that human ought to be able to do, since our brains are trained to operate in a 3-dimensional world. But we can play a simple trick to draw pictures of 4 dimensional polyhedra by looking at their shadows. In the real world, the shadow of 3-dimensional object on a wall is 2-dimensional, and can therefore be accurately represented on a piece of paper. So, it is therefore possible to represent a 4-dimensional object by imagining what its shadow would look like on a 3-dimensional “screen”.

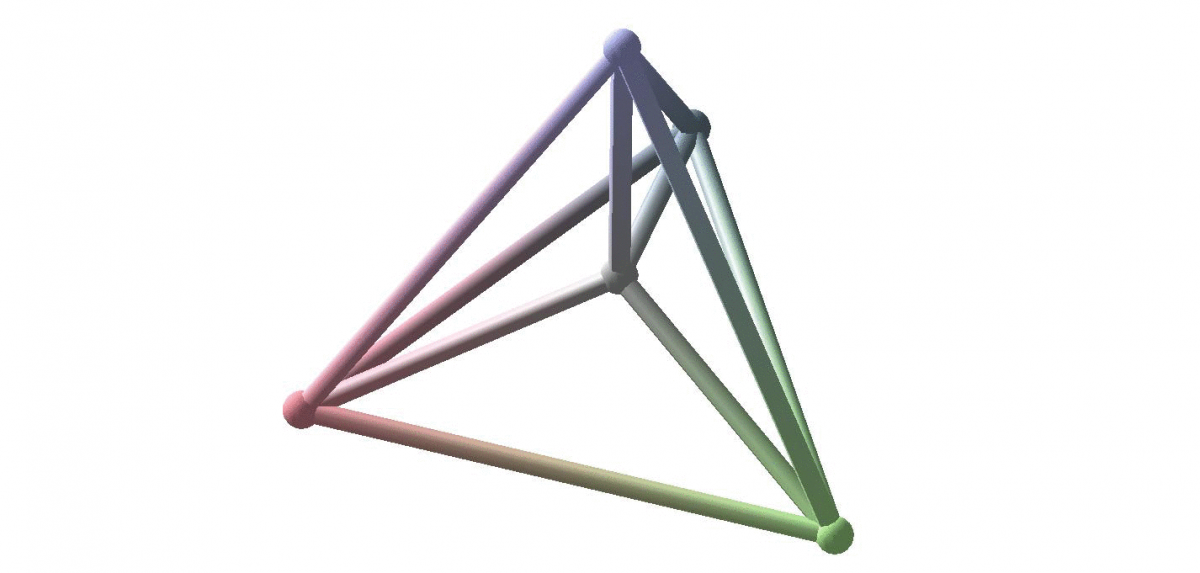
That’s exactly what the animated gifs shown below demonstrate: a 3-dimensional rendering of the shadow of several examples of these objects. Each of the polyhedra is rotating in 4-dimensional space.

In order, the polyhedra depicted are the 5-cell (two views), the 8-cell (two views), the 16 cell, the 24 cell, and the 120 cell. The animations were prepared using Maple.