For a recent research project on discrete spacetimes, I have been using finite element methods to solve the Helmholtz equation on various interesting 2-dimensional triangulated manifolds. A little while ago, I realized that a neat by-product of these calculations is the ability to easily solve the free particle Schrodinger equations in these geometries. In the physics literature, this problem is sometimes called “quantum billiards” because it is the quantum mechanical analogue of studying the motion of billiard balls (on oddly shaped tables).
Here is an example:
This movie shows the position probability density of a free particle confined to an elliptical cavity (i.e. the modulus squared of the position space wavefunction). Here is a version of the same movie with the trajectory of a classical particle with the same initial position and velocity as the quantum wavepacket superimposed:
At the initial time, the particle is localized near the centre of the ellipse and has a velocity directed up and to the right. The particle’s wavepacket scatters off the walls of the ellipse several times. Each collision caused the wavepacket to spread out in space, and, by the end of the movie, the particle is de-localized over most of the ellipse. Interference patterns are formed as portions of the reflected wavefunction from different collisions interact with one another.
In the above movie, you should be able to see that the ellipse is actually made up of a bunch of small coloured triangles. This is because I am not actually solving the Schrodinger equation within a continuous elliptical region, I am rather solving for a discrete version of the wave function defined on a triangulation of the ellipse. By making the triangles smaller one gets a better and better approximation to the continuous case. But the catch is that as the triangles get smaller, the computational time to generate the movies gets longer. The movies on this page are the result of simulations that take a few hours on my laptop.
Here is another movie in a related geometry, the Bunimovich Stadium:
The Bunimovich Stadium is essentially a rectangle with semi-circular caps. It is interesting because a classical particle contained within it exhibits ergodicity. That is, if you consider a classical billiard ball in this region with a random initial position and velocity, is trajectory will (almost always) eventually fill up the entire stadium uniformly. The above simulation is possibly hinting at the quantum analogue of this classical ergodicity, with the final wavefunction configuration being even more dispersed than the elliptical case.
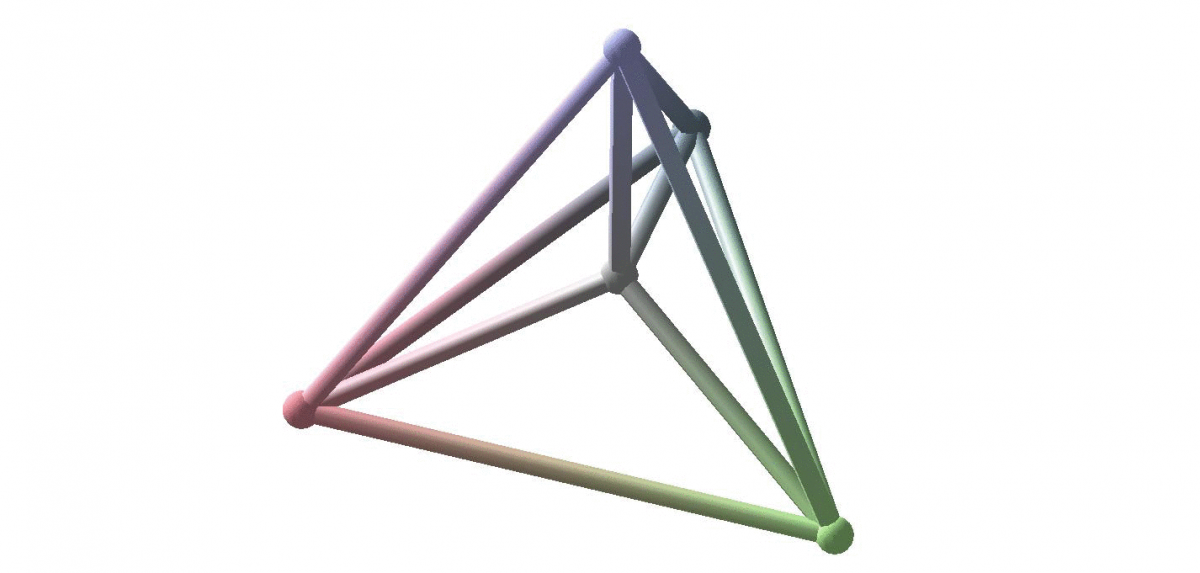
The next example I looked at was meant to be similar to the famous double slit experiment:
In this movie, the particle lives in a circular arena with a triangular obstacle in the middle. The obstacle cleaves the particle’s wavefunction in two, essentially meaning that there is an equal probability of measuring the particle taking a path above or below the triangle. After the splitting, we can see the development of intricate interference patterns, just like in the double slit experiment.
Here is another example of a wavepacket interacting with a 2-dimensional barrier:
In this case, the particle undergoes a glancing collision with a circular obstacle in a hexagonal arena.
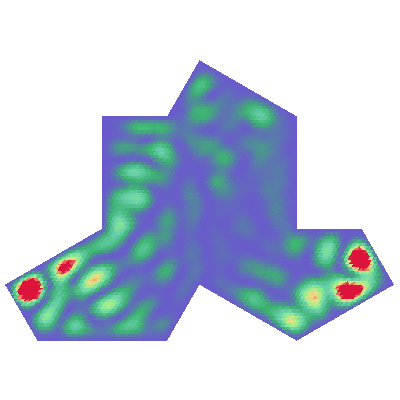
Finally, this movie shows a quantum particle confined to the newly discovered aperiodic monotile:
The aperiodic monotile has a remarkable property: it can be used to tile a 2-dimensional plane in a completely non-repeating way. It is pretty unclear to me how the tiling properties of the monotile might relate to the trajectory of confined quantum particles, but it does make for a pretty movie…